
Control Room Dashboard
A dashboard for monitoring weaving and fabric dyeing operations, integrating data from the MRP system and machine control systems, and displaying the results in the Control Room.
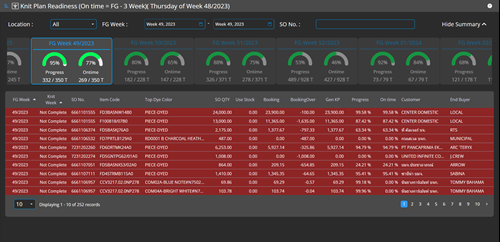
Displays the weaving plan data for each SO line, enabling SCM to identify SO lines that require urgent weaving planning and to verify whether the reserved greige fabric quantity and the ordered weaving quantity are sufficient for each SO line.
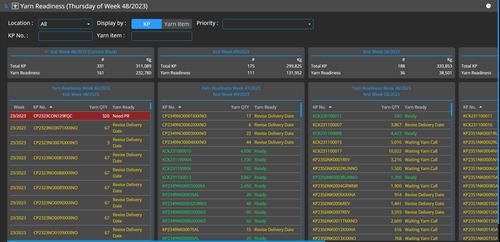
Displays yarn readiness in two perspectives: KP view and Yarn view, allowing SCM to monitor yarn availability for each KP. It also enables verification of whether the yarn quantity in stock and PO in is sufficient compared to the yarn required for the planned KP, and provides a yarn usage trend chart to support future demand assessment.
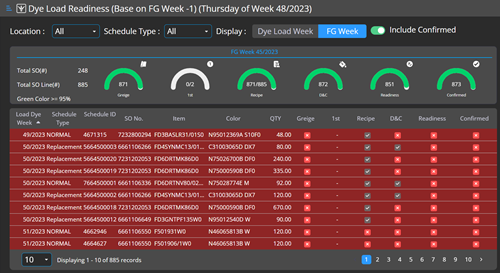
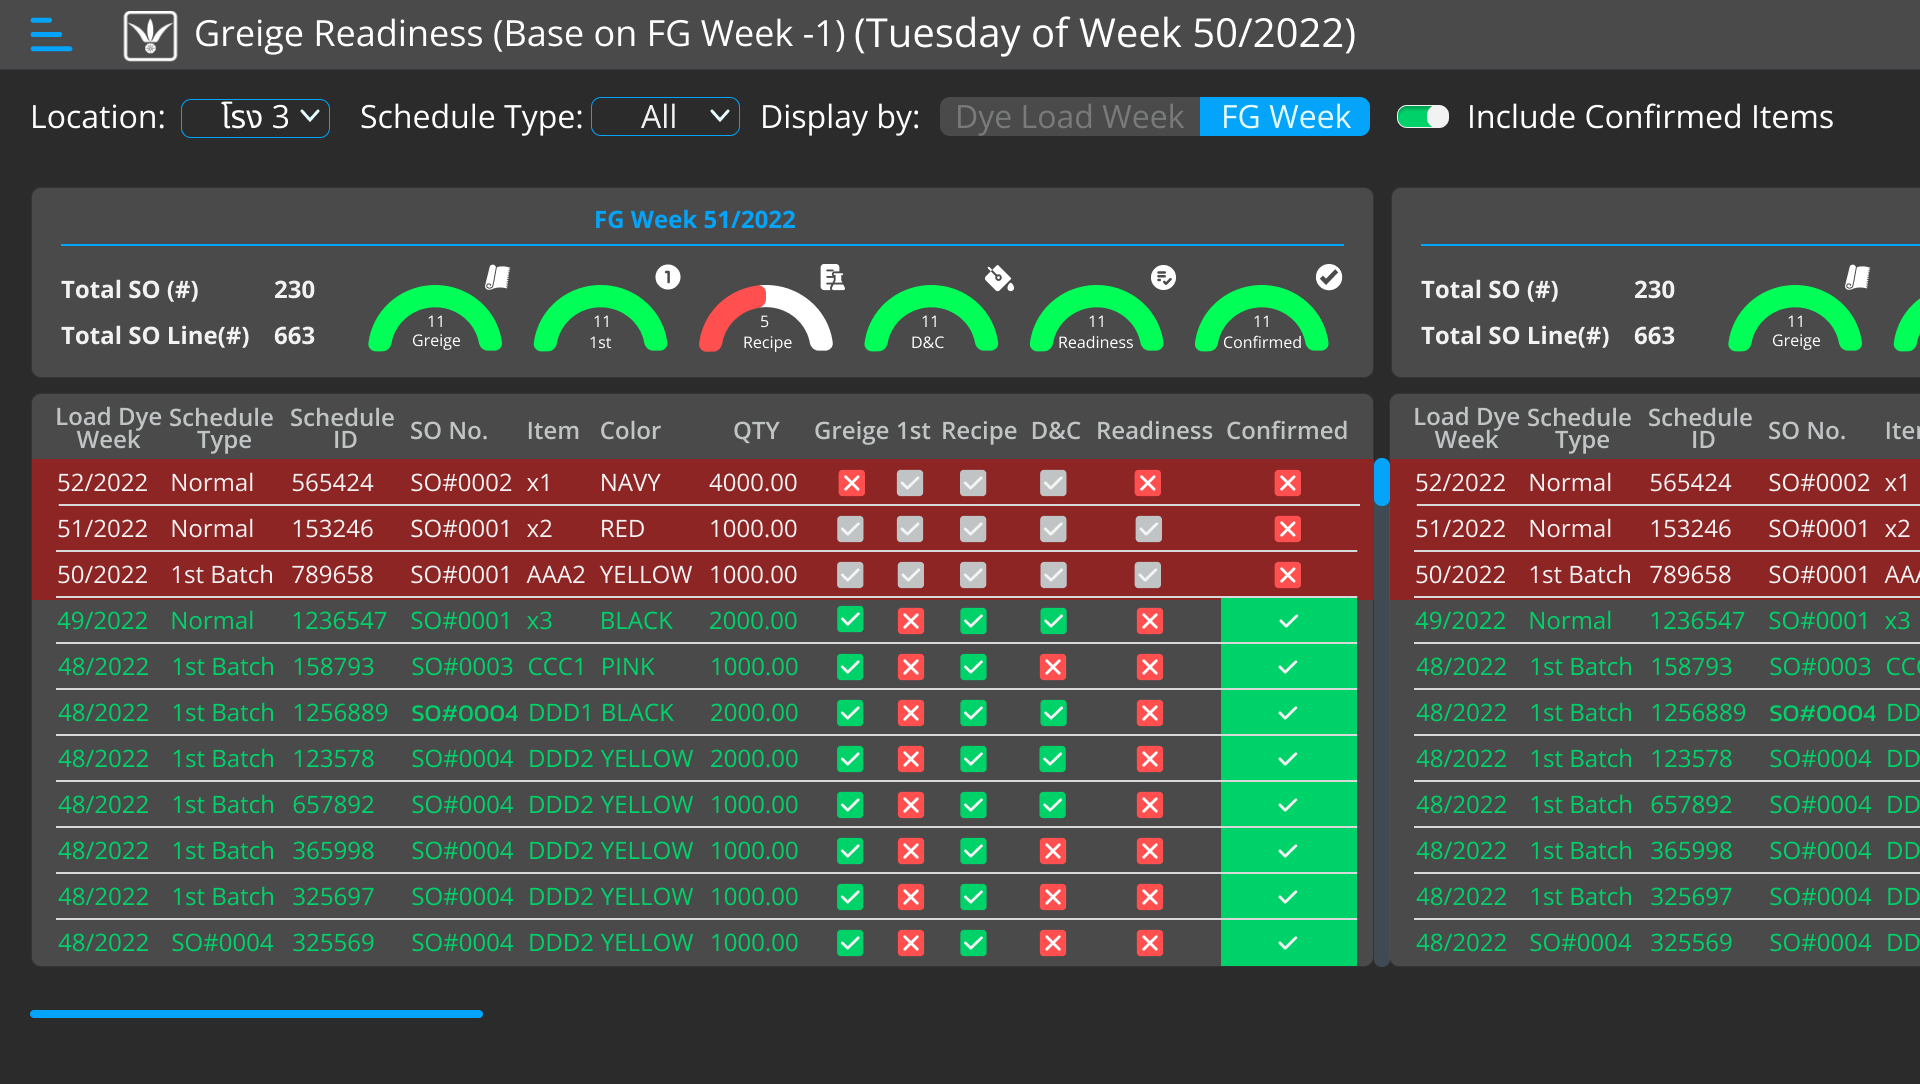
Displays the dyeing plan list with readiness details for each item, and summarizes weekly progress, enabling SCM to confirm readiness before dyeing can proceed.
Displays the list of tasks assigned to the Lab, allowing the Lab team to view all required work items along with the lead time of each item. The system can also summarize outstanding tasks and send notifications via email or LINE.
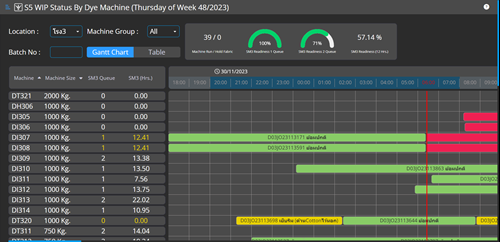
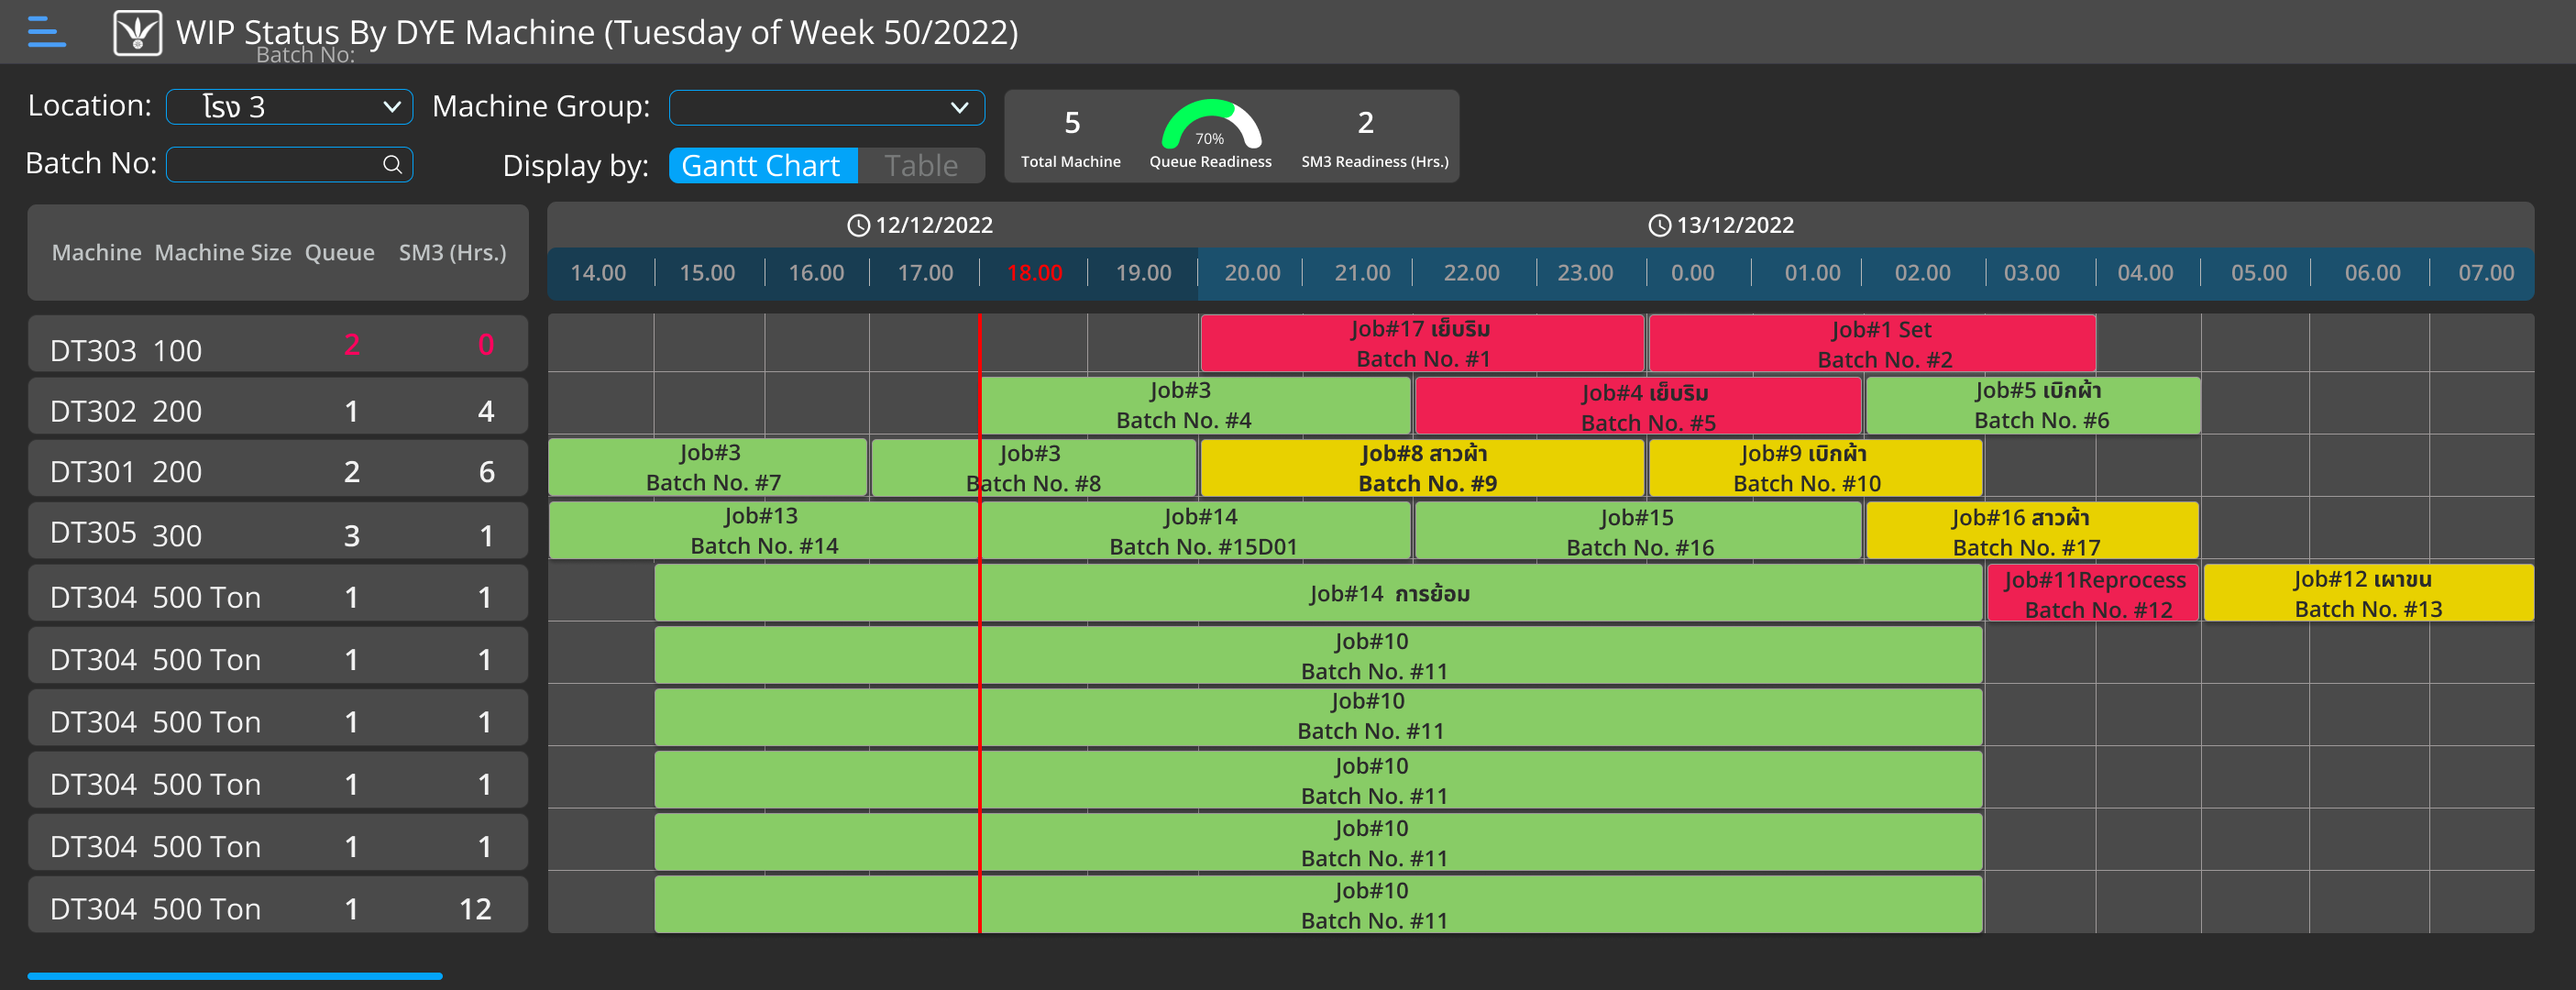
Displays the dyeing queue for each machine by dye house, enabling the Fabric Center and PPC teams to review queue readiness and confirm whether each queue is ready to proceed as planned. Views are available in both Gantt chart and table formats.
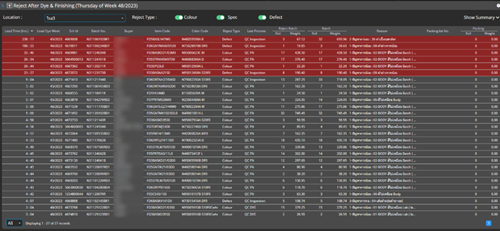
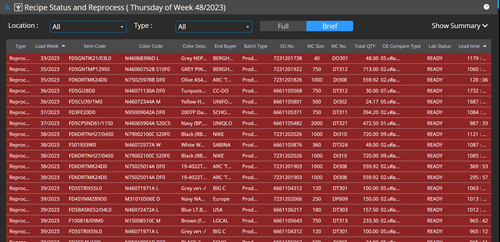
Displays the list of rejected batches pending decision, enabling authorized users to review rejects from QC, QT, and QA, decide on the appropriate reprocess method, and track how long each item has remained in rejected status (lead time since rejection).
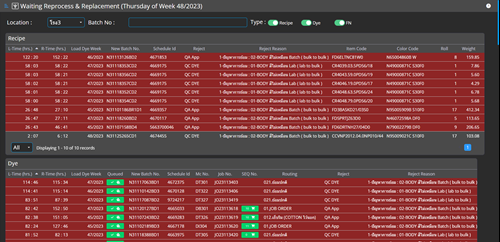
Displays outstanding reprocess and replacement tasks, providing visibility to relevant stakeholders so these items can be prioritized during planning and decision-making.
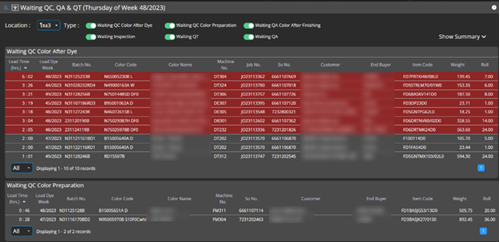
Displays work items pending QC, QA, and QT, allowing quality teams to view their own workloads. Items are categorized by process and include the lead time for each item.
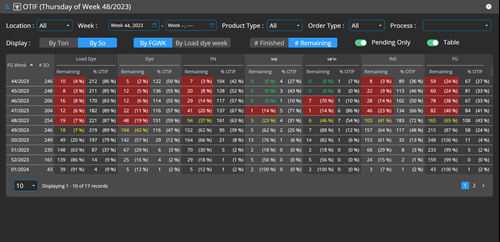
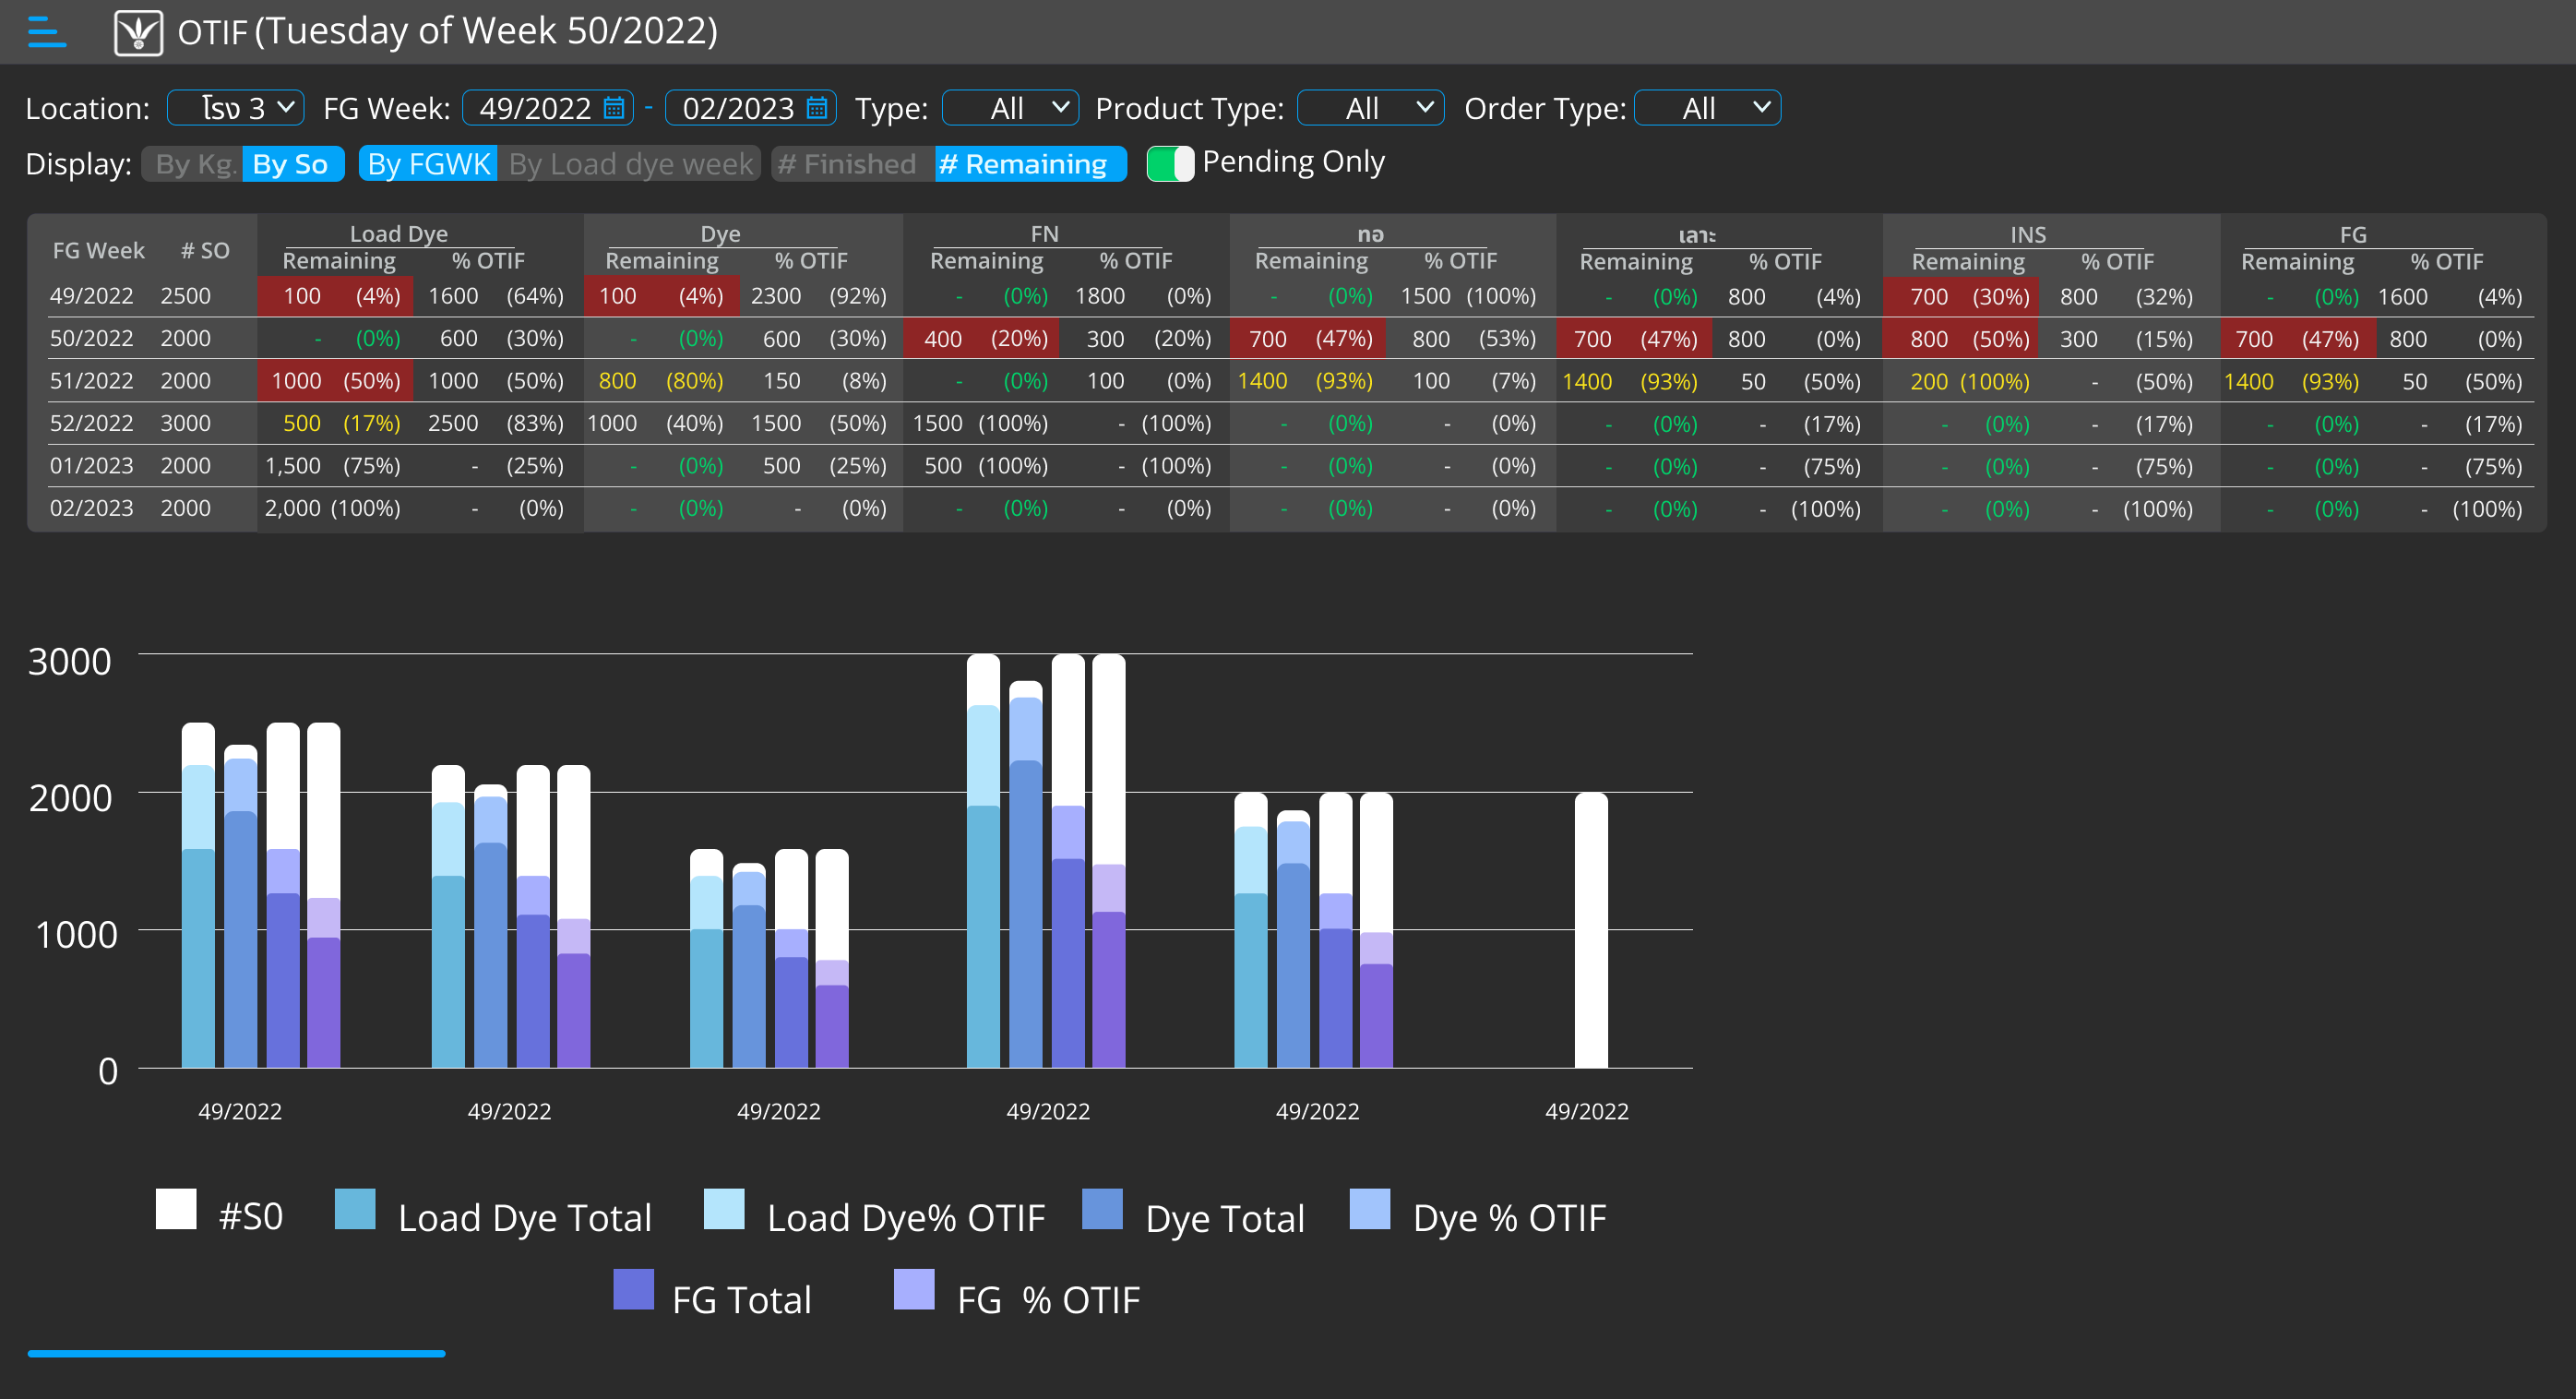
Displays a weekly summary of how many SOs remain in each process, along with OTIF performance per process, providing an overall view of where SOs are currently located in the workflow. OTIF results are calculated and displayed by week to support continuous improvement. The summary can be viewed in two perspectives: FG Week and Load Dye Week, and users can drill down into the details of outstanding items.